Are the 49ers skilled, or just lucky?
Fans of the two football teams who face off in the Super Bowl will no doubt spend the weekend filled with nervous anticipation - hopeful that their team will emerge victorious, but certain of the knowledge that there can only be one champion. For the rest of us, we must hang our heads with relative degrees of shame, and bide our time until the next season brings with it the promise of new opportunities for all 32 NFL teams.
For a San Francisco 49ers fan like myself, most of the last decade has been spent in a fairly constant state of disappointment. But after ten years without a playoff appearance, the team blossomed this season under the influence of new head coach Jim Harbaugh, and came within one game of their first Super Bowl appearance since 1995.

This poster hangs proudly in our apartment.
Despite a great season, in which the team won 13 of their 16 games for the first time since 1997, many people have still voiced doubts about whether or not this team is for real. What if this season was just a fluke? After all, quarterback Alex Smith, long jeered by 49ers fans since being drafted in 2005, was the starting quarterback for every game this season. And while his stats this year were his best ever, they don't compare favorably to quarterbacks like Tom Brady, Aaron Rodgers, or Drew Brees. While the offense might not be the flashiest, this year it was relatively error-free; combined with stellar defense and special teams units, the 49ers were able to grind out wins fairly consistently from week to week.
The question remains, though, no matter how much the fans may try to ignore it: how much of a role did simple luck play in the 49ers season? To answer this question, of course, one needs a way to measure the team's luck, and compare it to other teams. Alternatively, one needs to look at some measures of skill, and show that in fact, the 49ers simply were a more skilled team this year, both compared to other teams in the league and compared to the 49ers of previous seasons. Here I'll talk a little bit about luck, and in a follow-up post I'll talk more about skill.
In what sense could the 49ers be considered a lucky team during the 2011 season? Well, one way to look for a team's luck is to measure the strength of the opposing teams during the course of the season. If your team plays all of its games against terrible opposing teams, then it's more likely your team will have a favorable record, even if it's only mediocre, simply by virtue of the fact that the teams it plays against aren't very good. Conversely, if your team plays all of its games against very strong teams, it will be much harder to get a winning record. Bearing this in mind, we ask: how lucky were the 49ers in terms of the strength of the opponents they faced?
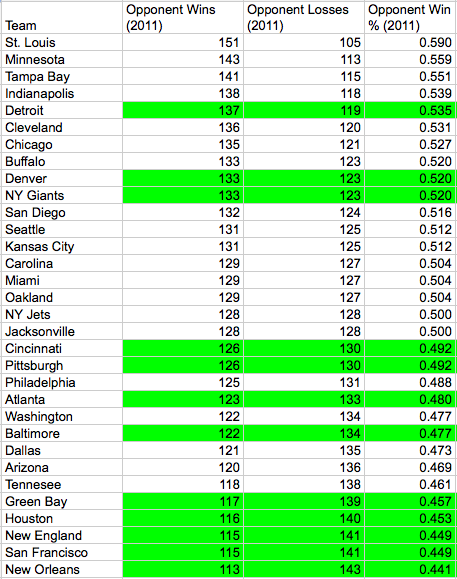
The answer, as many football fans could probably guess, is fairly lucky. Part of this stems from the fact that the 49ers played six of their sixteen games against opponents from their own division, which is not known for its strength. Here's a list of all teams in the 2011 season, ranked by the strength of their schedules.

Table 1: 2011 strength of schedule. Green indicates teams that made it to the playoffs.
As you can see, the 49ers schedule is ranked near the very bottom, tied with New England and just above New Orleans. So the schedule was relatively easy. Having said that, I've heard many people attribute the success of the 49ers solely to the ease of their schedule, but have not heard the same criticism made for teams like New Orleans, New England, and Green Bay. To remark on the ease of the 49ers schedule without pointing out the collective ease of all of these teams' schedules seems a bit unfair.
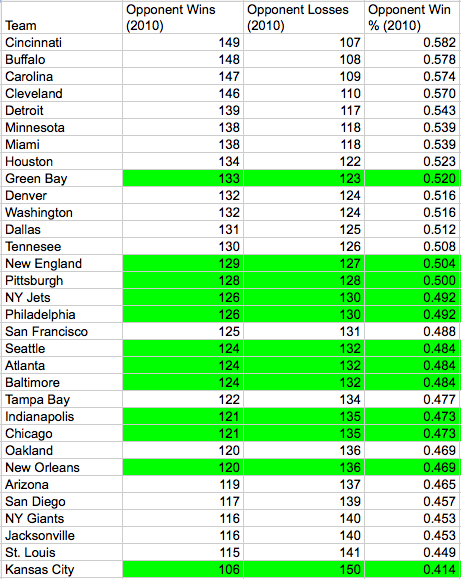
Let's ask another question: how does the strength of the 2011 schedule compare to the strength of the 2010 schedule? Here's a new table, just like the one above, but with data from the 2010 season:

Table 2: 2010 strength of schedule. Green indicates teams that made it to the playoffs.
In the 2011 season, the 49ers were much closer to the middle of the pack as far as strength of schedule is concerned. Comparing year over year, based on this data, it would not seem unreasonable to attribute some of the 49ers' newfound success to their relatively easy schedule.
But wait! the careful reader may exclaim. There's a chicken-and-egg argument to be made here: did the 49ers improve in 2011 because they had an easier schedule, or did they have an easier schedule because they had improved? Indeed, San Francisco's 13 wins in 2011 correspond to an extra 13 losses for their opponents, as compared to only 6 wins for the team in 2010. Any conclusions drawn from the above data must keep this in mind, since the opponents wins for any team are not independent of the team's performance.
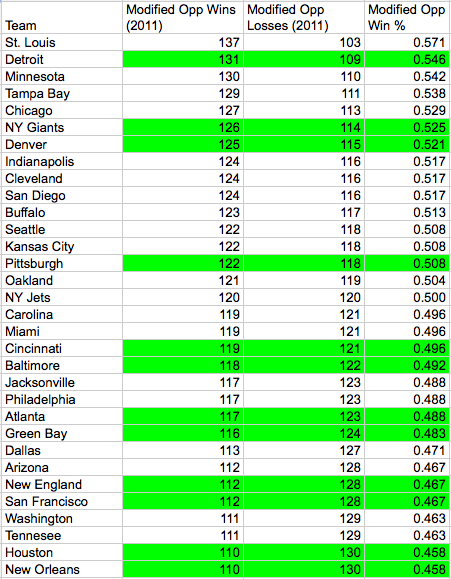
One way to try and correct this is to remove each team's performance when considering the strength of the opposing teams. So, for example, in 2011 the teams the 49ers faced won 115 games and lost 141, for a win percentage of just 0.449. However, if we remove games played against the 49ers, who had a record of 13 wins and 3 losses, then among all remaining games, the teams the 49ers faced won 112 games, and lost 129, for a slightly higher win percentage of .467.
If we make this adjustment across all teams for the 2011 season, the following picture emerges.

Table 3: 2011 Adjusted 2011 strength of schedule. Green indicates teams that made it to the playoffs.
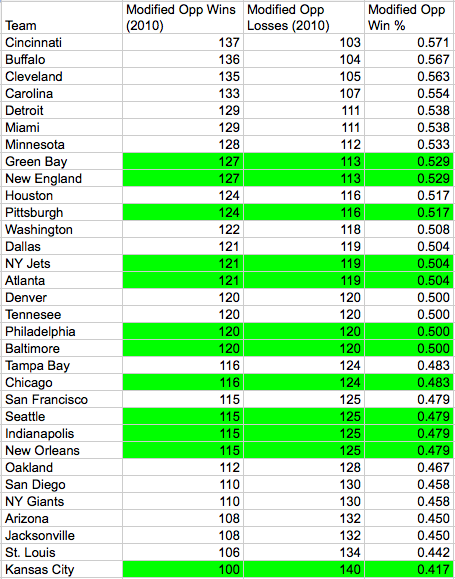
While San Francisco's schedule still ranks near the bottom after this adjustment, a few other teams have slipped just below it. How does this compare to the previous season? To wrap things up, let's look at the adjusted strength of schedule for 2010.

Table 4: Adjusted 2010 strength of schedule. Green indicates teams that made it to the playoffs.
Notice that in absolute terms, the difference in the 49ers' schedule is quite small comparing the adjusted 2010 season to the adjusted 2011 season. In 2011, the number of adjusted games opponents won was 112, versus just 115 in 2010. So from this standpoint, much of the 49ers' progress in 2011 appears to be due less to having a lucky schedule, and more do to with actual improvements of the team. As promised above, next time I will dig a little deeper in an attempt to quantify the 49ers' improvement during this season. For now though, I must pick out an appropriate outfit to wear this Sunday, in mourning of the absence of this team from the Super Bowl.
(A final note for the more statistically minded: In 2011, the correlation between a team's winning percentage and the opponents' combined losing percentage is quite high - the correlation coefficient is roughly .766. With the adjustment mentioned above, this drops to .529, which agrees with the notion that there should be a weaker correlation between one team's record and the combined record of its opponents when the team's record is removed from the combined record. For 2010, the correlations are a bit weaker: .574 and .333, respectively).
Psst ... did you know I have a brand new website full of interactive stories? You can check it out here!
comments powered by Disqus
